Peak Width
Peak Width is one of the most misunderstood integration parameters in Empower CDS.
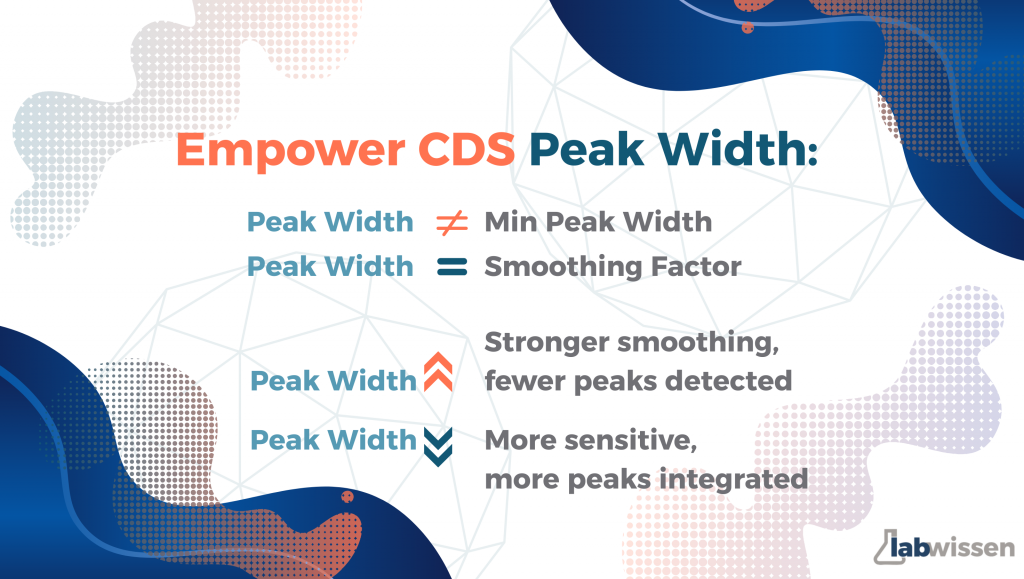
Most analysts believe that peak width defines the minimum width of a peak to be integrated. In reality – it’s a smoothing factor.
When Empower integrates a chromatogram, it processes all the data points. Since real data isn’t perfectly clean (there’s always some noise), a smoothing filter needs to be applied.
 The higher the Peak Width, the stronger the smoothing.
The lower the Peak Width, the more sensitive the integration – meaning more small peaks might be detected.
I always explain it this way in my trainings:
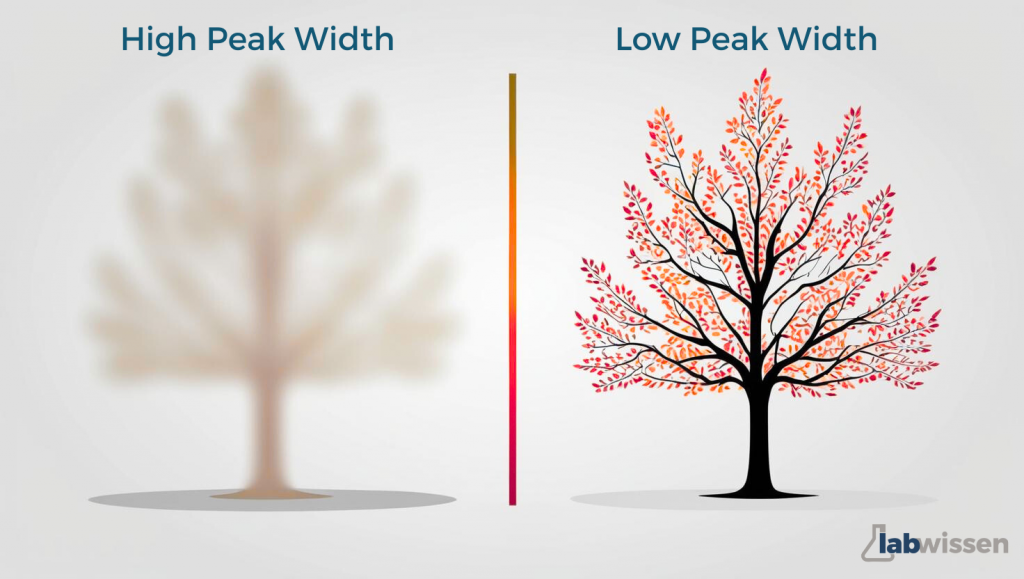
Imagine you’re looking out of a window at a tree 
With one pair of glasses, you only see the shape of the tree  – no details, no leaves. That’s a high Peak Width.
Now switch to a sharper pair of glasses – you can see every leaf  . That’s a low Peak Width.
Did you think of Peak Width this way before?
 Pro tip: Open one of your chromatograms and experiment with different Peak Width values. See how the integration changes – and if this explanation clicks for you.